For most of us, owning a home is an important goal and milestone in our lives. It is the largest financial investment we make in our life. Finding out if it is a good time to invest in real estate is one of the key questions for people who want to buy a home.
This is a decision that will finally lead all of us to a housing loan with an average tenure of 15 years, making a significant dent in our monthly budgets, thanks to the loan EMIs. So what would be a good starting point that can help us make an informed choice in the matter?
Biggest gap in the real estate sector: Lack of data
An earlier article takes a detailed look at the regulatory problems of the sector. But more than regulation, lack of data is one of the greatest challenges of the real estate sector in India. It’s very difficult to discover the price of real estate in any given area. Prices in the same area could vary significantly and there is no visibility in the trend of the prices in the given area.
In countries like the United States, where the housing index is well developed and very broad-based, it is easy to discover the price and trends of the housing sector. A housing index is the equivalent of a stock market index like Sensex. It tells us how the sector is doing based on data points. An increase in the index indicates an increase in prices of homes on average and vice versa.
Housing Sector data in Chennai – Residex
No city in India has data comparable to what developed countries with mature housing markets have. But a very humble beginning was made in India in 2007. The National Housing Bank, owned by the Reserve Bank of India started publishing various indices to track the housing sector.
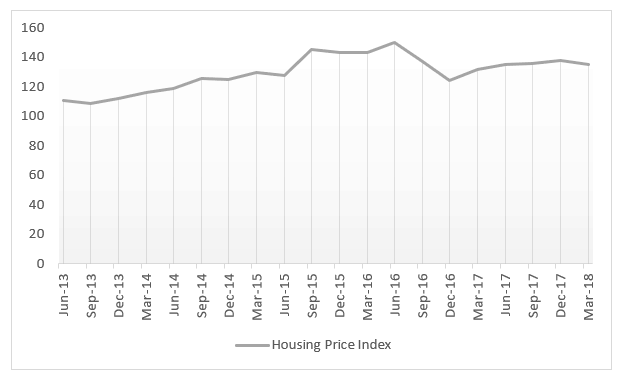
The Residex is a combination of two major indices – Housing Price Index(HPI) and Housing Rental Index, of which only the price index is available for 50 cities now in the country.
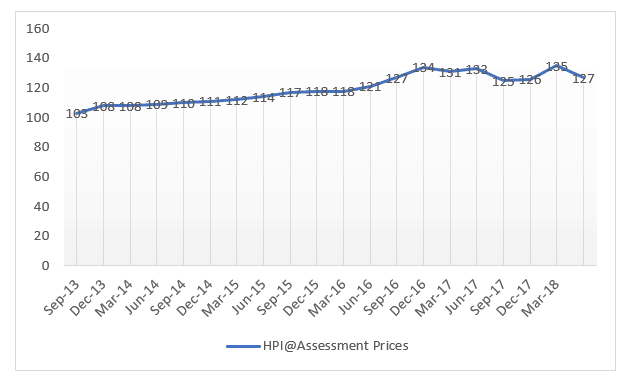
The price index again has a sub-index to track the market price of homes under construction homes as well as the assessment price for constructed homes. The same for Chennai is available below.
A third sub-index of HPI, registered price — the price at which a property is registered with the state government — is still not available. Usually this is different from actual market price in practice, either because the buyer wants to avoid paying stamp duty or the seller wants to avoid taxes on the profit earned, or because of the black money component involved in many transactions.
Assessment Price Index of Constructed Properties in Chennai
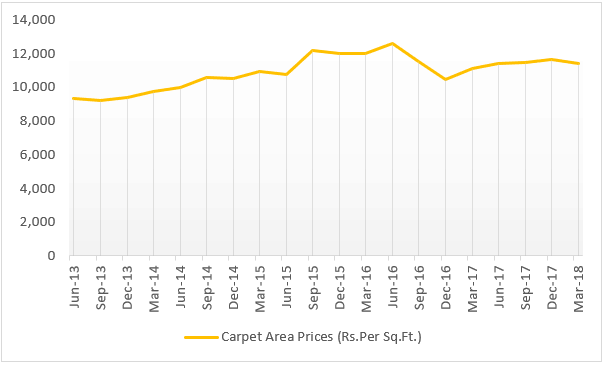
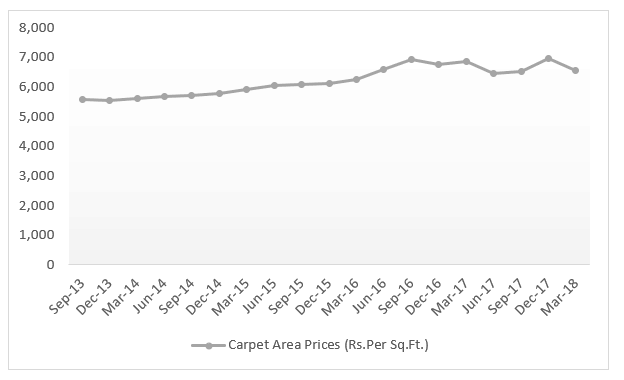 Market Price Index of Under Construction Properties in Chennai
The NHB used to publish a zone wise data for Chennai as well till early 2015, with an earlier base year, but has now discontinued the practice with changes in the zoning itself.
Housing market going through a turbulent phase
As can be seen from the Housing Price Index ,the housing sector is going through a turbulent phase since June 2016. This turbulence prevails across all cities in India, and is not just specific to Chennai. A report released in November 2017 by Liases Foras, an independent research company, captures the turbulence in the table below:
|
Housing Sector data – Chennai |
|||
| Q2 2016 | Q2 2017 | %Change(YOY)* | |
| No of units sold | 3,526 | 3,111 | -23% |
| Unsold units | 53,044 | 63,913 | 20% |
| Weighted Average Price (Rs/Sqft) | 5285 | 5262 | Negligible |
*YOY – Year on Year
Clearly the number of units being sold has come down and the unsold inventory has risen dramatically. The price of an average home available in the market is not affordable for most of people in the city. This mismatch between supply and demand in terms of affordability, triggered a decline of the housing market.
Demonetisation further accelerated the fall by immediately reducing cash availability which is critical for the construction industry. It also temporarily disrupted the availability of black money component. Now with PAN card being made mandatory for property registration, real sector transactions are being open to increased scrutiny than earlier.
Buy or Rent – what is better?
The rental income from renting a property in most areas of the city is around 2-3% of the value of the property for an year. This rental income is known as annual rental yield. But the housing loan interest is around 9 – 9.5%. With a down payment of around 20-25% which can get a fixed deposit return of around 7%, the net interest paid on terms of the value of the house comes to 8.5 to 8.87%. The difference between the rental yield and net interest paid, then, is around 6.5%.
This means that the property should appreciate by at least 6.5% every year for EMI payments on the home loan to be more profitable than renting, during the tenure of the home loan. If the property does not appreciate as much, one is better off paying the rent and investing the amount saved in EMI and downpayment in appropriate saving instruments.
However, as seen, the housing market is overpriced and annualised growth of the housing price has been only 4% in the last five years, as can be inferred from the index. A stagnant or slow growing market will further reduce the annualized price appreciation in upcoming years. Even otherwise, for an apartment to grow at 6-5% to 7% for 15 years – the duration of the home loan tenure – is unlikely.The excessive appreciation of real estate in the previous decade has taken property prices to astronomical levels, and the market is currently going through a price correction phase.
This makes renting a better deal in most of the metropolitan cities, including Chennai, looking at the issue purely from a financial asset perspective. But, of course, living in your own house has non-monetary benefits and comfort implications.
How RERA affects the game
The Real Estate Regulation Authority formed in all states by a parliament legislation, is aimed to increase reliability in the sector and help with better dispute resolution between the buyer and the promoter. It has already tightened regulation for the real estate projects. It has published a list of registered projects, agents and also rejected and withdrawn projects, thus making the information easily available to a buyer.
RERA was formed in Tamil Nadu in June 2017. It has 280 projects registered in 2017 and 548 in 2018 so far. Among the 548 projects registered in 2018, 317 are from Chennai and Kanchipuram district. But even so, RERA has made slow progress in Tamil Nadu and needs to do a much better job capturing all the existing projects.
According to the website it has 265 ongoing complaints and has passed orders on 28 complaints. Buying a RERA-registered property insures against various risks associated with real estate transactions. A major chunk of unsold inventories are not under the purview of RERA, and only a very small inventory is registered with RERA. As more promoters and more projects come under RERA over the years, the risks may be expected to come down significantly.
The sales of under construction projects across cities has anyway taken a hit, with people preferring to go for completed projects as it helps them avoid paying rent as well as EMI for the house loan, often for an indefinite period due to delays by the promoter. A stricter implementation of RERA rules may work to some extent in mitigating the risks and promoting demand.
The stagnation in the real estate sector, however, is likely to continue in the near term, as the housing sector is yet to correct the mismatch between supply and demand. The data of both NHB and the independent agency still has some way to go to catch up the kind of data available in mature markets, but it does reflect the stagnation in the sector.
In India real estate prices are decided by sheer greediness.